Rob Fahndrich
9/18/2009 16:30 | ok, how can i make this query work with the webpart? my issue is with the label and data row.
ERROR: Column 'Data' does not belong to the table.
SELECT count ( roomnumber ), 'Mill Pond Point' FROM tblarmasterreferences WHERE roomnumber like '1%%%' and currentstatus = 'InHouse' UNION ALL SELECT count ( roomnumber ), 'Whispering Way' FROM tblarmasterreferences WHERE roomnumber like '2%%%' and currentstatus = 'InHouse' UNION ALL SELECT count ( roomnumber ), 'Cloverdale Lane' FROM tblarmasterreferences WHERE roomnumber like '3%%%' and currentstatus = 'InHouse' UNION ALL SELECT count ( roomnumber ), 'Sugarbush BLVD' FROM tblarmasterreferences WHERE roomnumber like '4%%%' and currentstatus = 'InHouse' UNION ALL SELECT count ( roomnumber ), 'Coldwater Creek Trail' FROM tblarmasterreferences WHERE roomnumber like '5%%%' and currentstatus = 'InHouse' |
|
Rob Fahndrich
9/18/2009 21:04 | ok, so i changed my query to something much easier.....select BedCount, Neighborhood From Testtable.....my label column is NEIGHBORHOOD and my data column is BedCount........ I am still getting this error....ERROR: Column 'Data' does not belong to the table.
|
|
Juerg
9/23/2009 12:17 | Rob,
we have found the cause for the �Column Data does not belong to table� error and have fixed it in the meantime.
Please re-download the ZIP file, extract and then replace the DLL. Please also do an IIS reset if you deployed the web part to the GAC.
|
|
Jorge Besada
9/25/2009 16:12 | when i use two or three data series, how can I specify what color to draw each line with? In my testing all lines are drawn in same color
Thanks |
|
Jorge Besada
9/25/2009 16:15 | nevermind that last question... saw solution in documentation... |
|
Gene Vangampelaere
10/12/2009 09:50 | I'm having a problem when i configure the webpart:
Error: Request for the permission of type 'System.Data.SqlClient.SqlClientPermission, System.Data, Version=2.0.0.0, Culture=neutral, PublicKeyToken=b77a5c561934e089' failed.
Inner Error: Object reference not set to an instance of an object.
Can you help me with this? I want to connect to a SQL database and I'm using the following connectionstring:
Initial Catalog=mydbname;Data Source=servername;Integrated Security=SSPI;
|
|
Juerg
12/30/2009 13:56 | Gene,
the settings on your Sharepoint server do not allow to have this web part in the BIN folder. Please move it to the GAC instead (by dropping it into �c:\windows\assembly�).
Please perform the move operation using Windows Explorer (not via a command prompt) either directly at the server or via RDP (not via a network share).
Then delete the web part DLL in the BIN folder followed by an IISRESET to unload/reload the DLL from memory.
|
|
Chetan
1/13/2010 15:34 | For SQL statements, can we use stored procedures? |
|
Juerg
1/14/2010 16:51 | Chetan,
we have now updated the Web Part to also support Stored Procedures.
(see updated description above). |
|
Jack He
1/16/2010 03:10 | First time user. After I configures databse and query string, the chart image only displays as an "x�� icon, with these words next to it: "Simple Chart". No error message was given, though. Thanks for help. |
|
Juerg
1/18/2010 11:21 | Jack, can you send us the HTML source of the Sharepoint page for inspection ([email protected]) ? |
|
Ray
2/18/2010 17:50 | I am getting same problem as Jack is there a solution for |
|
Juerg
2/18/2010 17:57 | Ray,
something must be wrong with the way you select the data. Can you send us either the HTML source or the full URL of the broken image link (it contains quite a lot of parameters) for analysis ? |
|
Patrik
3/4/2010 08:32 | Hi Juerg,
I've downloaded a number of your web parts to evaluate, but the only one I've gotten to work is the AESQL (SQL Query Viewer) webpart.
All the other ones I get the standard error message when trying to add the web part: "Unable to add selected web parts". The web parts that I haven't been able to add are the following: SQL Chart, Google chart, EWS Calendar, Dilbert, Media player. When trying to preview the web parts in the web part gallery, "Cannot import the AE SQL Chart Web Part. " is displayed - except for the working SQL query viewer web part...
All of the respective dll's are dropped in the GAC. The safecontrol lines have been added to the web.config file. The ULS log simpy displays the same error message, classed as eventID 6611 and critical. Trust level is WSS_medium.
I am evaluating WSS as concept for my company, and as such is running WSS 3.0 on a Win 2003 machine on Windows Internal Database.
Any ideas on resolution or how to trap the error? If all would have failed I would have assumed some general setting, but since the SQL query viewer works?
Thanks in advance |
|
Patrik
3/4/2010 09:29 | Got it working, sorry to bother you. No IISreset had been performed after dropping the dll's into the GAC. |
|
Tony
3/30/2010 15:26 | Interesting idea... could work well for me, but my site runs via SSL so I need to retrieve the charts via SSL as well to avoid some browser warnings. Google Charts API doesn't support SSL officially, but https://www.google.com/... works. Is there any way of configuring the base URL used by this web part, or is it hard-coded? |
|
Juerg
3/30/2010 17:11 | Tony,
Google actually does not support SSL for its Charts API.
The https://www.google.com/chart?cht=lc&chs;=200x125&chd;=s:helloWorld example is misleading since it only returns a �fake� chart (you cannot pass actual data series that way).
The only workaround would be to have the server fetch the image via http and then make it available locally (eg. acting as a proxy). |
|
Sarah
5/11/2010 12:54 | Hello
I have just installed a trial of this web part and am trying to configure it. We are using windows authentication but keep getting the following error:
Error: Login failed for user 'NT AUTHORITY\ANONYMOUS LOGON'.
Inner Error: Object reference not set to an instance of an object.
Please can someone advise me on this?
Thanks
Sarah |
|
Juerg
5/11/2010 16:38 | Sarah,
you most probably encountered the "double hop" problem: This is a problem that occurs if you are trying to access a database that is installed on a separate database server with the current user's credentials.
Windows is not able to pass the user's credentials from the SharePoint server to the SQL Server if you are using NTLM authentication.
You can use Kerberos to authenticate against your web application and turn on delegation. If you use delegation, the web application that you are running your web part from will delegate the user's credentials to the SQL Server. Because the credentials are delegated, the credentials will be passed to the SQL Server without a problem and you will get rid of the double hop issue.
Note that in order for your SharePoint web application to use Kerberos authentication you have to configure this on your web application: (see http://technet.microsoft.com/en-us/library/cc263449.aspx)
You also could use SQL Authentication to authenticate against the database.
As you are passing SQL credentials in the connection string no double hop issue will occur. This would however require you to turn on SQL authentication on the SQL Server. |
|
Andy Gallon
6/14/2010 11:01 | Having the same problem as Jack (16th Jan 2010) - clearly an error in rendering the chart but don't know why. Data set is visible (and correct) if the Inspect Query Data option is ticked, but no chart. Any help appreciated. |
|
Juerg
6/15/2010 12:49 | Andy,
can you send us the HTML source of your page with the "Inspect SQL Query Data" option turned on ? |
|
c_manboy
6/23/2010 07:24 | Great webpart! Is there any way to sum or count the data for a pie chart, similar to the sharepoint list charting webpart that you have? I think it uses sum:columnname. The other question is if there is a way to include the percentage value of a pie chart? |
|
Juerg
6/23/2010 20:01 | c_manboy,
since the web part gets it�s data via an SQL SELECT statement, you can actually use the SUM() and COUNT() operators in conjunction with the GROUP BY clause to return the sum (or count) of groups of data.
Example (based on the SQL Server Northwind database):
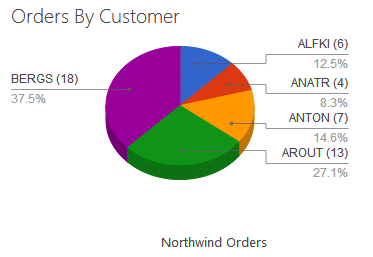
SELECT COUNT(*) AS Total, CustomerID FROM Orders GROUP BY CustomerID
Regarding the display of percentage values in a pie chart: This is a good suggestion and we will incorporate this feature in the next release. |
|
c_manboy
6/23/2010 22:59 | Thanks for the reply! I adjusted my queries to accomodate the SUM and COUNT values. If we purchase the webpart are we eligible for free updates and if so, for how long? Secondly, is it possible to adjust the font size and color of the labels? |
|
Juerg
6/24/2010 12:38 | c_manboy,
yes, you'll get free updates for the whole lifetime of the product.
You can adjust the axis label font size and color by appending a formatting string to the "Data Series Column Name(s)" setting:
Example:
Total:0,FF6600,16|1,3366CC,14
eg. append a colon, followed by the axis index (0=X-axis,1=Y-axis), the font color (RGB value) and the font size (in points). Separate the 2 axes by a pipe symbol.
For pie charts please also append &chxt;=x,y
Example:
Total:0,FF6600,16&chxt;=x,y
eg. append a colon, followed by the axis index (0 for pie charts), the font color (RGB value) and the font size (in points).
|
|
Ben
6/25/2010 18:51 | Do you have an example of how to connect SQL Chart web part to Excel file stored in sharepoint site report library? Thanks! |
|
Juerg
6/25/2010 19:03 | Ben,
to our knowledge you cannot create an OLE-DB connection using http, so the file needs to be on a local drive.
In this case use the following connection string for Excel:
Provider=Microsoft.ACE.OLEDB.12.0;Data Source=c:\test.xlsx;Extended Properties="Excel 12.0 Xml;HDR=YES"
The equivalent of a database table is a marked range in an Excel spreadsheed.
Thus you'll first need to set up a marked range (say "ProductRange") in your spreadsheet:
SELECT * FROM ProductRange |
|
Ben
6/25/2010 20:26 | Thank you Juerg. This will not work for me since all Excel files are stotred within sharepoint sites. Thank you again for your help! |
|
Juerg
6/28/2010 12:29 | Ben, you can try to use the Sharepoint UNC path to your Excel files in the connection string (as eg. \\yoursharepointserver\yoursite\yourlibrary\yourfile.xlsx ) |
|
Jason
7/10/2010 16:17 | Simple Question, How to get Query Sting value into the chart SQL query from Query sting filter? I have a SQL Query which contains, Where ID=@ID, I have a Query string web part on that page, How to link it with my chart Query?
cheers |
|
Juerg
7/12/2010 12:06 | Jason,
please use the {1} placeholder (as provided by a connected Filter Web Part):
SELECT * FROM SomeTable WHERE ID={1} |
|
Nancy Lavoie
7/20/2010 19:39 | Hi, I need to know how to proceed to make a graphic in Sharepoint 2007 with Google SQL Chart Web Part. I would like to connect to an excel file as my data source (DB connect string).
What is the Select Query? Do I have to do something in my excel file first?
Thank you!
|
|
Juerg
7/20/2010 19:50 | Nancy,
just use regular SQL Syntax, where �MyRange� (see example below) is a named range within a work sheet (just mark a block of cells and then assign a range name to it via the right mouse contect menu).
Include the Header row as the first row of your range.
You then refer to this range as follows (eg. the range takes the place of the DB table):
SELECT * FROM MyRange WHERE some condition... |
|
Clement Chan
10/6/2010 18:42 | I am having a problem when I try to chart from an excel spreadsheet.
I put in "Provider=Microsoft.ACE.OLEDB.12.0;Data Source=\\eoneis3\usb\Status Board Doc\Q2 WK12 broz edit.xls;Extended Properties="Excel 12.0 Xml;HDR=YES"" as my connection string. I created a range called usbstatus and used "SELECT * FROM USBStatus" as my SQL Query. The string in the data source is the Sharepoint UNC path. I also filled in the data series column names with the columns i want, but I get an error saying " Failure creating file"
Please help! Thank you. |
|
Juerg
10/7/2010 14:12 | Clement,
is the �WebClient�service running on your Sharepoint server machine ? This service is needed to access the Sharepoint Library via UNC.
You might also try to map the UNC path to a network drive on the server and then use the drive letter in the connection string instead of the UNC (I am not sure if the OleDB provider accepts UNC paths). |
|
Travis Terlinden
12/14/2010 19:14 | I downloaded the evaluation version and I'm trying to pull some data from an Excel sheet. The SQL syntax is fine, and when using Inspect SQL Query Data, it looks like the data itself is fetched correctly.
The problem is I keep getting an error stating: Data column error:[Column Name]. Also, each piece data is being shown as "data(0) = " without incrementing as I assume it's supposed to, so I'm not sure if that's contributing.
Any help would be greatly appreciated. Thank you. |
|
Juerg
12/14/2010 20:12 | Travis, can you send us your web part tool pane settings to [email protected] for analysis ? |
|
Anita
1/26/2011 17:04 | How do I format currency to display with two decimals? The field is already formatted as a sum. |
|
Michael McGuire
2/3/2011 21:32 | I am trying to implement the webpart connecting to a SQL Server not on the same box. The "Source=" contains the dns and port number 1.2.3.4,111. I can not connect to the DB. There are firewalls on both boxes but the SP sever is in both. The error I get is:
Error: A network-related or instance-specific error occurred while
establishing a connection to SQL Server. The server was not found
or was not accessible. Verify that the instance name is correct
and that SQL Server is configured to allow remote connections.
(provider: TCP Provider, error: 0 - A connection attempt failed
because the connected party did not properly respond after a
period of time, or established connection failed because
connected host has failed to respond.)
And suggestions or insight would be appreciated. |
|
Juerg
2/4/2011 10:54 | Michael,
is your SQL Server configured to allow remote connections (see Microsoft Help article at http://support.microsoft.com/kb/914277/en-us)?
In the SQL Management Studio, right click the SQL server instance, choose �Properties�, and under �Select a Page list�, click �Connections�.
Now you should see a checkbox labelled "Allow Remote Connections to This Server". Make sure it is checked. That should take care of the remote connection issue. |
|
Kfer
2/18/2011 00:07 | Great tool! One question, I am using the VerticleBar Type and would like to set a maximum value for the Y-axis. Is this possible? I have been trying to use the "chxr" paramater, but have had no success.
Thanks! |
|
Juerg
2/18/2011 13:35 | Kfer, do you want to cut off the bars at a specific value ? |
|
Chris B.
3/18/2011 16:22 | Would it be possible to inherit from a configured Amrein web part? My goal would be to do something like create a new web part using the Amrein web part, but have the configuration for it be pre-built into the new web part such that they can be added to pages easily by non-tech users. For example, if there is a need for a chart of Accounts by Industry. I would take my Amrein SQL chart, configure it with the data source, SQL statement, etc., then create a new web part from this so that the user could easily add it to their own personal dashboard page. The ultimate goal being that they have 10s or 100s of preconfigured KPIS, charts, etc. to choose from and be able to pick and choose. Thanks! |
|
Juerg
3/18/2011 17:15 | Chris,
there are three options:
- Export the pre-configured web part(s) and tell the users to re-import the web part(s) as needed. Please see the following article: http://community.bamboosolutions.com/blogs/sharepoint_blank/archive/2009/01/08/how-to-export-amp-import-web-parts-in-sharepoint.aspx
- Upload the exported .webpart file into the top site�s web part gallery which makes it available in the web part gallery
- Pre-configure the web part via appSettings variables in the web.config file. When embedding a web part, it will use these values as its default configuration (which can be re-configured by the users).
|
|
mike
5/20/2011 20:30 | Is there a way to embed a hyperlink to another web part/SharePoint Google SQL Chart? We would like to "drill-down" and pass a parameter or simply link to another chart which has more detailed information.
thanks. |
|
Chris
10/25/2011 18:59 | I wish this webpart was NOT using Google Public API. It requires companies to send their data to Google, which is a NONO for most (like mine). Is there any chance this could be avoided with another "local" 2d graphic api?
That would be GREAT!
Thanks |
|
Anita
11/9/2011 17:55 | when i use multiple data series, how can I specify what color to draw each line with? In my testing all lines are drawn in same color Thanks |
|
Juerg
11/9/2011 18:40 | Anita, please use the "Chart Color" setting to specify a color for each data series in the following format (example is for 3 series):
cc0000,00cc00,0000cc
(values are RGB hexadecimal) |
|
Anita
11/16/2011 18:11 | Can I set a default value for the filters? |
|
Juerg
11/22/2011 15:35 | Anita, we have now added the filter preset feature as follows:
Each dropdown filter can optionally be preset by adding the preset value as follows:
@Month=April |
|
Matt
12/13/2011 14:48 | The default value for the filters is not working.
For example, if I enter @Year=2009, it shows this as the error message:
Combo Fill Error: Column 'Year=2009' does not belong to table.
The year 2009 is in the table... |
|
Juerg
12/13/2011 17:32 | Matt,
we just recently added this feature with version 1.1.27.
Can you quickly check the web part�s version number by opening the web part�s tool pane and looking it up at the top ?
If you have an older version, please re-download the updated Zip file from our web site, extract and then replace the DLL, followed by an �iisreset� command if you placed the DLL in c:\windows\assembly. |
|
Matt
12/16/2011 17:11 | For the default filter, I am continuing to have an issue with it. In the Edit Form of the web part, under the Search Filter(s) field, I entered: Yr@=2011
I am trying to have the default dropdown show 2011. However, when I enter the above in the Search Filter(s) field, on the actual graph, it shows Yr=2011: [Dropdown box]
Is there a problem with this or does it need to be fixed? Thanks |
|
Kuerg
12/16/2011 18:19 | Matt,
there is indeed a bug which displays the default value also in the search field label.
You can actually fix this by adding a friendly search box label as follows (by adding a pipe character followed by the desired label name):
@Yr=2011|Year
We have fixed the bug in the meantime, so you also could re-download and re-install the solution. |
|
Cheryl
1/6/2012 22:17 | Is there any plan to include Gannt charts? |
|
Karenli
1/9/2012 07:13 | When i trying to make a graph base on an excel file, I get this Connection error: The Microsoft Access database engine could not find the object 'RangeA'. Make sure the object exists and that you spell its name and the path name correctly. If 'RangeA' is not a local object, check your network connection or contact the server administrator.Error: Cannot find column 0.
My connection string is
Provider=Microsoft.ACE.OLEDB.12.0;Data Source=c:\Book5.xlsx;Extended Properties="Excel 12.0 Xml;HDR=YES"
and the SQL Query is
SELECT * FROM RangeA
RangeA is defined name is the excel file and it is including the column name.
|
|
Juerg
1/9/2012 16:30 | Karenli,
your connection string looks OK.
You can alternatively specify your SQL query as follows:
Example 1:
Treat the selected worksheet as the data table:
SELECT * FROM [Products$]
(where �Products� is the name of the worksheet, followed by an �$�)
Example 2:
Treat the defined range in the selected worksheet as the data table:
SELECT * FROM [Products$A1:D10]
(where �Products� is the name of the worksheet, followed by an �$� and the cell range) |
|
Juerg
1/10/2012 18:23 | Cheryl,
there are currently no such plans, partly due to the fact that it would be somewhat non-trivial to define an SQL query which would define the tasks, milestones and the task dependencies (say a task might only start after another one has been completed etc.).
You might consider to use an �external� List (assuming you are running SP 2010) connected to your SQL Server and then use the Sharepoint �Gantt View� view format to display the List as a Gantt chart. |
|
Doug
3/26/2012 15:11 | Do you have plans to allow the web part to accept multiple filter inputs, so we could use {1} and {2} for example? |
|
Adriano
4/24/2012 22:04 | in the property "Extra Google Chart Parameters" to draw the graphic, the data are sent to gogle or anything else is optienen graphs without sending query data |
|
Juerg
4/25/2012 17:11 | Adriano,
yes, the raw data is transmitted to the Google Chart web service via https (SSL) to render the chart. Google warrants that the transferred data are not stored or used for any purpose by Google.
We will also switch to the new Google Visualization Chart API for the next major version of the web part (where no data will need to be transferred anymore). |
|
Juerg
4/25/2012 17:14 | Doug,
we now expanded the number of filter web part connections to 12 which you can insert as placeholders {1} � {12} into your SQL query/command. |
|
Anita B
6/28/2012 17:54 | We recently installed the webpart on Sharepoint. When I configure my chart I get the error "Inner Error: Object Reference not set to an instance of an object". We are setyo wuth a SQL Server DB Conection string - not sure what other information you might need. |
|
RICHIE G
7/18/2012 19:57 | I was having the same problem as ANITA B. I am getting a "Inner Error: Object reference not set to an instance of an object." Please help.
|
|
Juerg
7/19/2012 17:19 | Richie,
can you turn on the web part's "Inspect SQL Data" setting and send us the additional output generated by the web part to [email protected] |
|
Matt
7/30/2012 15:06 | For some reason, my SQL Chart Web Part will not expand to the 1000 pixel height. I can have it expand 1000 pixel width but not height. The max I can go for the height is 300 without the chart not showing up on the web page.
I have the lastest update of the web part too so I'm not sure what is causing this issue. Any thoughts? |
|
Juerg
7/30/2012 15:11 | Matt,
the chart width and height is indeed limited to 1000 pixels and the product of these two values cannot exceed 300,000.
So if you for example choose 900px as the width, your maximum height will be 300,000/900=333px. |
|
Simon Evans
9/20/2012 14:06 | Help! I have the SQL chart working to produce a multi bar bar chart and am passing data to the y axis that represents percentage completion, however I have found that if one of the data elements doesn't contain an entry of 100% the y axis doesn't actually go up to 100%. I have tried using some of the google parameters to fix the y axis top and bottom values, but when I apply them although it fixes the y axis issue it creates a new problem in that my bar labels (values returned from within the SQL query) disappear.
Any help on how I might resolve this appreciated?
|
|
Thomas
10/19/2012 15:39 | Simon,
you can define the axis numbers absolutely, but then you must also define the range and the scale absolutely and you have to be sure, that the values don't exceed minimum and maximum. Otherwise the chart is wrong. E.g. you set the minimum to 40 and the maximum to 90. Add into the field "Extra Google Chart Parameters":
&chxr;=0,40,90,10&chg;=20,8.333&chds;=40,90
Description:
Range numbers: &chxr;=0,40,90,10
Explanation: 0: Axis 0 | 40: First number | 90: Last number | 10: step
Grid: &chg;=20, 8.333
Explanation: 20: Axis 0, 100/20=5 grid lines | 8.333: Axis 1, 100/8.333=12 grid lines
Scale max., min.: &chds;=40,90
Explanation: 40: min. value | 90: max. value
Find more information here. |
|
Jon
11/7/2012 15:14 | Is there a way for the charts to summarise the data they show? I am returning a dataset that has object name, progress status and a count value for each combination. In the chart I only want to see the record counts by progress status with the ability to filter whether I am looking at the entire record set or for a specific object. In the chart I currently have I get repeating values for the progress status for each object name? |
|
Geoff
11/15/2012 20:22 | 1) Is there a way to make the charts with a % width rather than a set pixel size, so they will auto size to the screen?
2) Also, we have set up a filter, but the preset value simply does not work. Is there a bug in the current version? I have tried @timePeriod=Week as well as timePeriod=Week and it will not prefill the filter either way. |
|
Thomas
11/16/2012 10:57 | Geoff
1) We added this feature to the actual version 1.1.34 downloadable at the top of this page. Optional you can enter 6 or 7 digits into the miscellaneous configuration field "Chart width (px)". The first 2 or 3 digits set the width percentage, the remaining 4 digits are for the size in pixels which is mandatory. E.g. 100% img width and 800px chart width: "Chart width (px)" = 1000800 or e.g. 75% img width and 1200px chart width: "Chart width (px)" = 751200
2) Sometimes the filter presetting doesn't work when the web part�s tool pane is open at the same time. Leave the page and navigate again to it. Check " Inspect SQL Query Data" in the miscellaneous configuration to examine what happens. Look for "Filter Preset=". |
|
Thomas
11/16/2012 11:15 | Jon,
there is no such feature. But a solution could be:
You define an additional column in the sql query:
DATA_OBJECT + ' ' + PROGRESS_STATUS AS DataStatus
Use DataStatus as new �Label Column Name�. This way you don�t get any more repeating labels. |
|
Geoff
11/19/2012 21:31 | We have 2 charts next to each other, one with a filter, one without. Is there a way to specify some text for the one with out the filter, so the grey filter section shows up with just that text present.
Because without it, the charts don't line up well, and look bad. |
|
Thomas
11/20/2012 16:25 | Geoff,
it's not possible to handle that this way. But you can go in page edit mode / HTML / "Edit HTML source" and insert the grey bar as HTML code at the top of the web part which has no filter bar, to align both web parts. In the HTML source there are placeholder paragraphs for each web part. |
|
Geoff
11/26/2012 23:06 | We are coming across the issue where our labels are long, and the charts become too large because of it. Could you possibly build in an option to hide the labels, and show them on mouse over? |
|
Thomas
11/28/2012 11:04 | Geoff,
because the applied Google API returns a HTML image (img tag) it's not possible to show labels on mouse over. But it can often help if you use e.g. horizontal instead of vertical bars. If it isn't necessary to show all labels then you can use the web part option "Show every nth Label". |
|
Sam
5/27/2013 11:21 | Is drilling down pie chart possible? If yes, how can i do it? |
|
Juerg
5/27/2013 19:29 | Sam,
this is currently not possible.
Would you be able to click on a pie slice to drill down ?
If yes, would you then want to be able to show another chart where the data is filtered via SQL by the selected pie slice ? |
|
Chip Chabot
6/12/2013 21:29 | We are currently using SQL Chart Viewer web part and are interested in upgrading it (we are on version 1.1.8). What is needed to upgrade the software to the current version?
Thanks in advance! |
|
Juerg
6/13/2013 18:41 | Chip,
please re-download the updated Zip file, extract the WSP file and then update the web part as follows:
Place the extracted WSP file in the c:\ root folder on your Sharepoint web front end server.
Then use the following Sharepoint PowerShell cmdlet (run as Administrator):
Update-SPSolution -Identity AESQLChartWebpart.wsp -LiteralPath C:\AESQLChartWebpart.wsp -GACDeployment |
|
Guillermo
8/8/2013 12:28 | Hi! Why AESQLChart does not render in SharePoint Designer (SPD) design window? It works perfectly in Explorer. Best, G |
|
Juerg
8/14/2013 17:48 | Guillermo,
the chart itself is created by the Google Chart API and is fetched as an image from the Google Chart API web site. It seems that the SPD design view is not able to reach out to the internet to fetch some content. |
|
Kathy
10/11/2013 17:06 | Hi Juerg,
We are having a lot of trouble configuring our charts. Is there an example that shows the webpart settings for a bar chart with bar groupings? For example, we are trying to chart our Giving each week for 3 years: this year, last year, and 2 years ago, with each having its own color. Do you have an example of one like this that we can use to help us set ours up? |
|
Juerg
10/14/2013 18:34 | Kathy,
can you outline how your data is organized (eg. how you select the data to be grouped by year) ? Is each �Giving� a column in your database table (having a �date� and an �amount� column) ? |
|
Kathy
10/16/2013 19:39 | Hi Juerg,
I apologize for that crazy select statement I sent you, we have since scratched it and started a new one. But, I just wanted to know if you could help us set up a vertical stacked chart. We also need to do a multi-bar chart. Are there are webpart setting examples you can screen capture for us so we can see how to configure them? |
|
Juerg
10/21/2013 12:42 | Kathy,
to display multiple data series (as for example in a stacked bar chart), please make sure to select the column that represent the labels (x-axis) and the columns representing the data series (y-axis):
Example for 2 data series:
SELECT labels, sales2012, sales2013 FROM table
Please then enter the label column name into the �Label Column Name� setting and the data series columns into the �Data Series Column Names� setting (each column name separated by a comma:
You then can either choose �VerticalBar� or �VerticalStackedBar� from the �Chart Type� setting to create either a side-by-side bar chart or a stacked bar chart. |
|
Aaron MacGillivary
8/27/2014 14:00 | The link to the Extra Google Chart Parameters is broken. I think it should point to https://developers.google.com/chart/image/docs/chart_params |
|
Juerg
8/27/2014 14:20 | Aaron,
thanks for pointing this out!
We have now fixed the link to the Google Chart documentation which now is at https://developers.google.com/chart/image/docs/chart_params |
|
Simon Evans
1/26/2015 19:00 | Hi,
Fantastic webpart!
We have an enterprise licence for this web part though the version we have deployed is v1.1.31. How do we obtain the most recent version?
Reagrds,
Simon |
|
Juerg
1/26/2015 20:48 | Simon,
just download the most recent version from this page, extract the WSP solution file and then update the web part solution. |
|
Simon
2/14/2015 12:38 | Hi,
I am using this webpart to produce a chart where the number of data points (based on past number of days) is determined dynamically by a filter webpart. I have got it working but I am not keen on the pop up window with radio button options the filter webpart produces. I have tried unsuccessfully to use a form filter webpart configured for a dropdown instead but when I try to come nnect the webparts I don't get the 'send to filter' option, which appears when connecting other filter types - only the 'send to field' connections. The later appears to create a variable with a name rather than a number and although I can get a chart the to ended when using the variable name it has no data points.
Also as the data points vary dependent on the filet selection (last 7 days, last 30 days, last 365 days, etc.) the display every nth label parameter causes a problem as I'd like every 1 label for a 7 day chart, every 7 label for a month chart, etc. is there a way to dynamically set this parameter for different data point volumes?
Many thanks. |
|
Juerg
2/16/2015 19:59 | Simon,
you actually could use our free �Filter� web part (see /apps/page.asp?Q=5835) which allows to send the selected value(s) to the SQL Chart web part where you can inject the transmitted values directly into the SQL query.
However, it is currently not possible to dynamically select the �Show every n ticks� depending on a filter setting. |
|
Jeff Henslee
12/4/2015 19:00 | Question:
Is it possible to display the value(s) of the datapoints being displayed.
For example if my data is total sales by plant and the total sales for plant 1 is $50, I would like to have a data label associated to my datapoint on my graph showing both the plant number (Plant 1) and my total sales dollars ($50).
Is this possible?
Please advise. |
|
Juerg
12/5/2015 15:24 | Jeff,
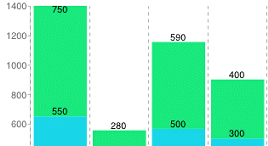
you can show the value numbers directly in or on the bars by entering the below into �Extra Google Chart Parameters� web part setting,
as e.g. for two data columns:
&chm;=N,000000,0,,11|N,000000,1,,11
For each Data Series you need a:
N,000000,0,,11
where 0 is the column enumeration starting at 0. The divider is |.
11 is the font size in pixels
000000 is the font color (RRGGBB).
|
|
Sean Cowherd
1/29/2016 16:58 | Could it be possible to add a date selector for a filter field? Being able to select a date from a calendar might be a better option that typing a date value in for our use.
Thanks. |
|
Juerg
1/30/2016 16:43 | Sean,
we have now added the option to configure a search filter as a date picker control by prefixing the date column in the �Search Filters� setting with an �#� character as for example:
#OrderDate
Please re-download the updated Zip file, extract the WSP file and then update the web part solution. |
|
Sean Cowherd
2/4/2016 16:27 | Again for the filter section: For those filters that use a text input box, can you possibly add an execute button for a user to click? Something that can have a custom label might be preferred. Sometimes users aren't sure to hit return on the keyboard to process the filter.
Thanks.
Sean
|
|
Juerg
2/7/2016 16:12 | Sean,
we have now added then new �Search Filter Button� web part setting which allows to (optionally) add a search button.
Please re-download the updated Zip file, extract the WSP file and then update the web part solution. |
|
mitu kumari
4/15/2016 08:57 | can we create a donut chart using this web part? |
|
Juerg
4/15/2016 11:25 | mitu,
this is currently not possible.
We plan to switch to the more recent �Google Visualization� API which will make this option available. However, the new web part release is still a few months away.
|
|
Peter
7/20/2016 10:01 | When displaying a stacked bar chart, horizontal or vertical, is it possible to display the total quantity/value of the bar next to the label? It seems as though using Label:(x) displays the value of the last of the Data Series columns, rather than the sum of all Data Series for that Label. |
|
Juerg
7/20/2016 12:29 | Peter,
you cannot display the sum of all data series, but you can display the vaule of each data series as shown below:
In this case please add the below to the web part�s �Extra Google Chart Parameters� setting (example given for 2 data series):
&chm;=N,000000,0,,11|N,000000,1,,11 |

 Great product! Easy install, just what we needed to get some quick wins!




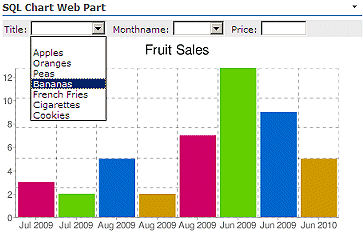
 SQL Chart Web Part Installation Instructions




 Post a Comment